Genetic association data from genome-wide association studies (GWAS) are foundational for our understanding of type 2 diabetes and other complex diseases. But in order to apply these results to diagnosis, drug development, and treatment, we need to identify the effector genes that explain those genetic associations. This is rarely straightforward: most SNPs associated with disease are located outside of coding regions of the genome, so that their impact on genes is not obvious; and even a variant located in a protein-coding gene may actually affect a different gene. And to complicate things further, a variant that is strongly associated with disease may not have a direct impact on a gene, but may rather be "along for the ride" with a tightly linked causal variant.
Today we have released a prototype, experimental version of an interactive tool in the Type 2 Diabetes Knowledge Portal that can help bridge the gap between genetic association results and the effector genes that are directly involved in disease. We are aggregating additional data types—for example, transcriptional regulation, tissue specificity, curated biological annotations, and more—and integrating them using cutting-edge computational methods in order to mine insights from GWAS data. The new Gene Prioritization Toolkit presents these data types and results to help researchers evaluate candidate causal genes around a genetic association signal.
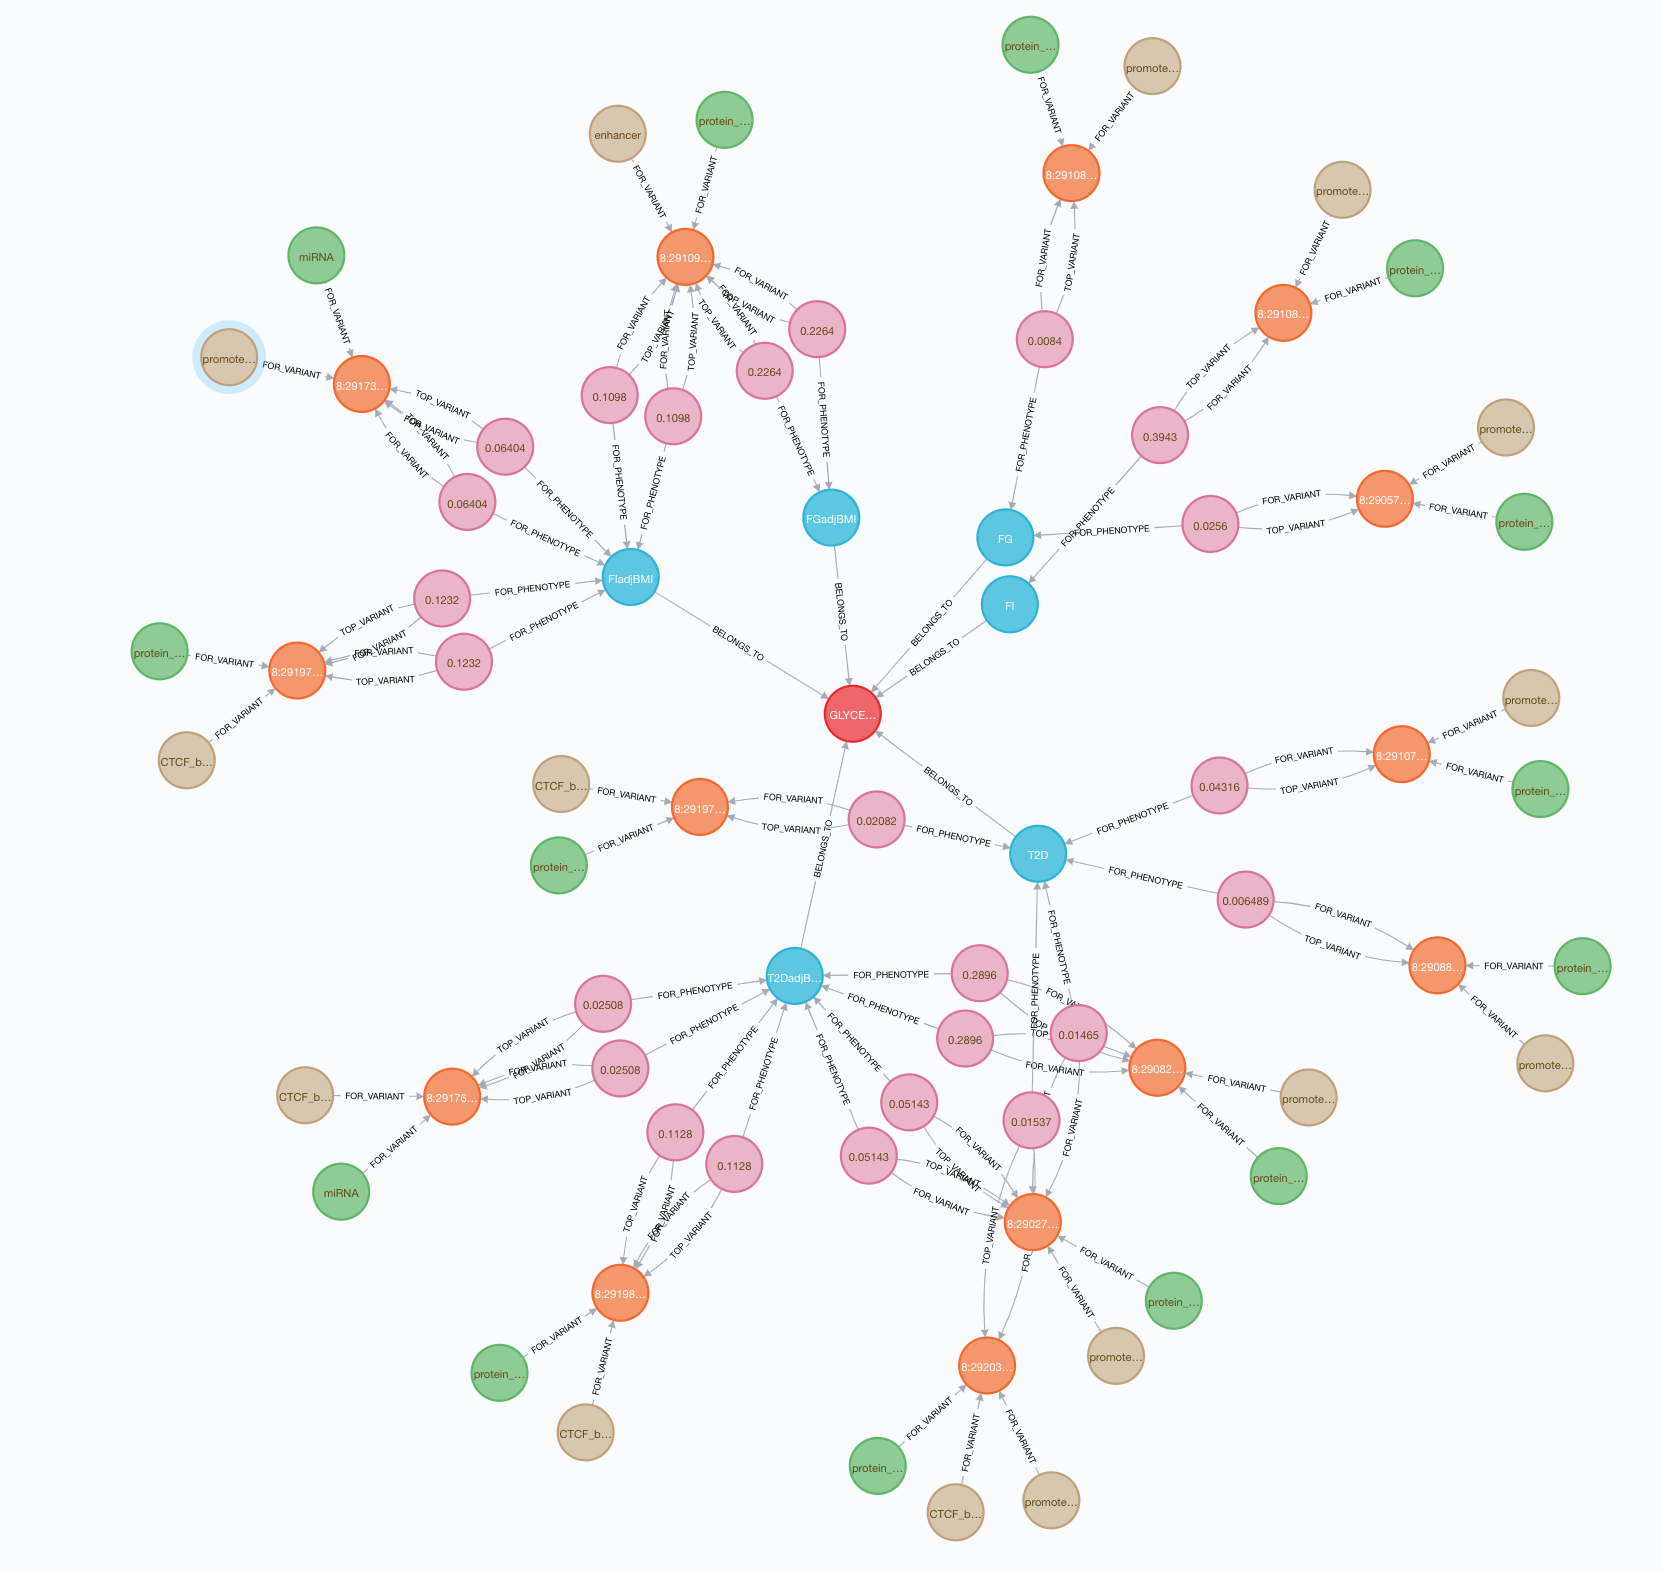
As a first step in developing this tool, we needed to find a way to store many different connections between variants, genes, tissues, phenotypes, and biological annotations. We decided to use a Neo4J graph database, which holds data nodes and their relationships with each other and can support complex, scientifically meaningful queries.
We have also created pipelines to apply computational methods to the genetic association data in the T2DKP. In brief, we are currently running:
- MetaXcan, which integrates tissue-specific expression data from GTEx and genetic association data to predict the potential that a gene is causal for a phenotype in a given tissue;
- DEPICT, which integrates multiple data sources including transcriptional co-regulation, Gene Ontology annotations, model organism phenotypes, and more to predict membership of a gene in a pathway and the probability of its association with a given phenotype;
- eCAVIAR and COLOC, two methods that quantify the probability that a variant is causal in both genetic association and eQTL studies.
We present the results of these methods in an interactive table on a new tab of the Gene page (see an example), "Genes in region". In addition to the results of the methods listed above, the table includes gene-level T2D associations generated by two types of burden test (Firth and SKAT) from an analysis of nearly 50,000 exome sequences by Jason Flannick and colleagues, as well as the phenotypes of knockout mice that are mutant for homologs of the human genes in the region, from the Mouse Genome Database. All of these methods and data types are described in more detail in our downloadable help documentation for the new interface.
The table shows all of these data types for each gene across the region. It has two alternative views: the Significance view, in which table cells are color-coded by significance, and the Records view, in which shading indicates the number of records in each cell. This visual summary allows you to compare genes quickly across methods. Clicking on a cell opens a window listing full details of the results.
The table supports versatile sorting, and columns may be dragged and dropped in order to group comparable genes. In addition, the table may be transposed so that the columns represent methods and the rows represent genes. This allows sorting by significance within a method, so that the gene with the most significant result for each method is easily identified.
This entire system, from data storage through the computational pipelines through the user interface, has been designed to be flexible and modular so that in the future we will be able to add new methods and data types easily and rapidly. As we actively develop the system, we are very interested in feedback from researchers about how to improve it. Please try it out and let us know what you think!